Consent analytics: see how visitors answer your cookie banner
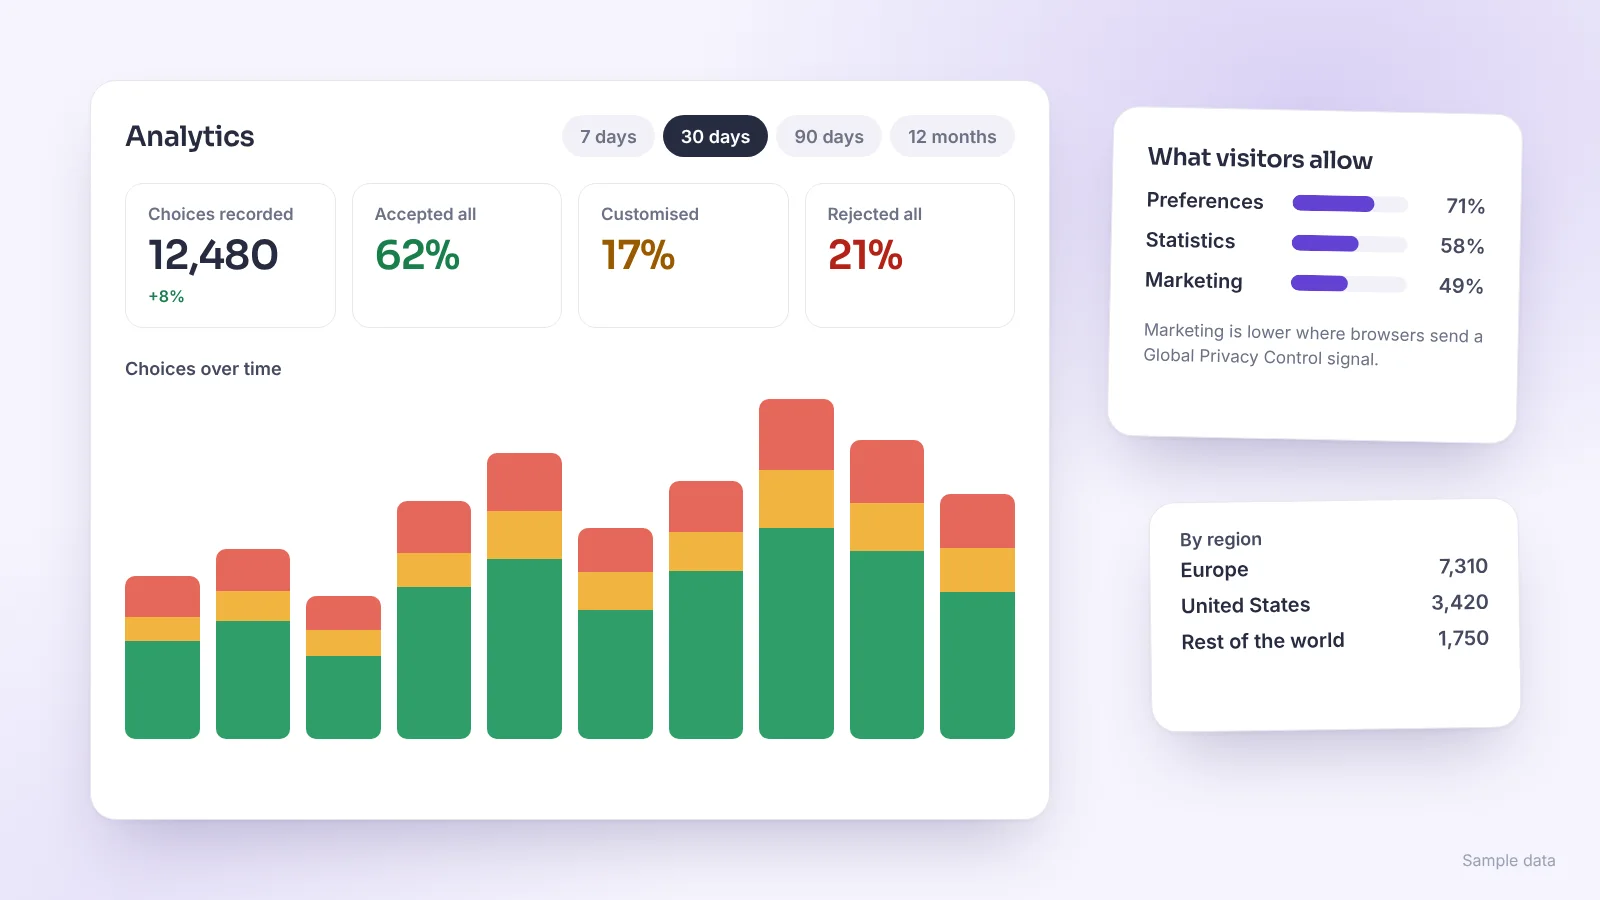
A new Analytics tab on the Cookies page turns your consent log into acceptance and rejection rates you can read at a glance.
- Choose a period: 7 days, 30 days, 90 days or 12 months. Each figure shows how it moved compared with the period before.
- Accepted all, Customised and Rejected all are shown in green, yellow and red, so a change is easy to spot.
- A chart of choices over time, split by answer, and the share of visitors who allow each category: Preferences, Statistics and Marketing.
- Break the figures down by region and by banner version, to see the effect of a new banner.